Essential Trading Tools Every Forex Trader Needs in 2026
 FXDetails Editorial Team
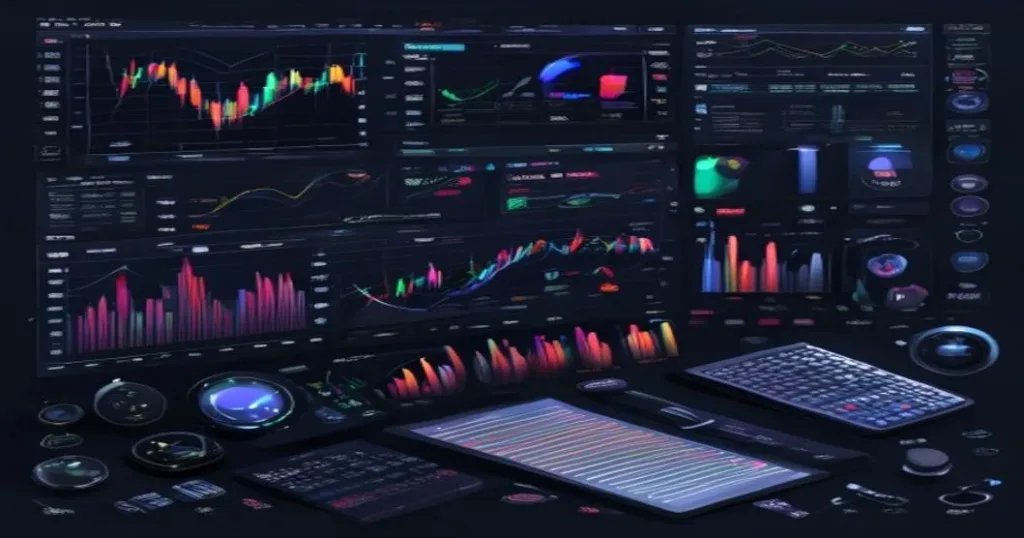
The forex trading landscape in 2026 is more competitive than ever. With algorithmic trading, AI-powered analytics, and real-time data streams flooding the market, having the right toolkit is no longer optional — it is the difference between reacting to the market and staying ahead of it. Whether you are a scalper hunting 5-pip moves or a swing trader holding positions for days, the tools you use shape every decision you make.
Why Your Trading Toolkit Matters More Than Ever
Markets in 2026 move on headlines, economic surprises, and algorithmic flows that can shift sentiment in seconds. A trader relying on a single chart and gut instinct is at a structural disadvantage. The modern trader needs a layered approach: execution platforms for speed, analytical tools for insight, and risk management systems for survival. The good news is that the best tools today are more accessible than ever — many are free or come bundled with a reputable forex broker account.
Charting Platforms: Your Command Center
The charting platform is where most traders spend 90% of their screen time. In 2026, two platforms dominate the conversation: TradingView and MetaTrader 5 (MT5). TradingView has become the industry standard for web-based charting, offering Pine Script for custom indicators, a massive community library of scripts, and seamless multi-device sync. MT5, meanwhile, remains the go-to for execution-focused traders who need depth of market, one-click trading, and MQL5 algorithmic trading capabilities.
The key is not choosing one over the other — many professionals run both. TradingView for analysis and idea generation, MT5 for execution. The integration between the two has improved significantly, with several brokers now offering direct TradingView execution.
What to Look for in a Charting Platform
- Multi-timeframe analysis: The ability to view the same instrument across 5-minute, 1-hour, daily, and weekly charts simultaneously.
- Custom indicator support: Whether through Pine Script, MQL5, or a plugin ecosystem, you need the ability to build or import custom tools.
- Alert systems: Price alerts, indicator cross alerts, and drawing tool alerts that work across devices.
- Backtesting: The ability to test strategies on historical data before risking real capital.
Technical Indicators: Less Is More
One of the most common mistakes new traders make is overcrowding their charts with a dozen indicators. In 2026, the most effective traders use a focused toolkit of 3-4 indicators that complement each other rather than duplicate signals. Here are the categories that matter:
Trend Indicators
The Exponential Moving Average (EMA) remains the workhorse of trend identification. The 20, 50, and 200-period EMAs are the most widely watched levels across all timeframes. When price holds above a rising EMA, the trend is considered intact. The Average Directional Index (ADX) adds a crucial layer: it tells you whether the trend is worth trading. Readings above 25 suggest a trending market; below 20 suggests consolidation where trend-following strategies underperform.
Momentum Indicators
The Relative Strength Index (RSI) on a 14-period setting remains the most popular momentum oscillator. But in 2026, traders use it differently — not as a simple overbought/oversold trigger, but as a divergence tool. When price makes a higher high but RSI makes a lower high, momentum is weakening and a reversal may be approaching. The MACD complements RSI by showing the relationship between two moving averages, with the histogram providing a visual read on momentum acceleration or deceleration.
Volatility Tools
Average True Range (ATR) is essential for position sizing. If ATR is 50 pips on EUR/USD, a 20-pip stop loss is statistically too tight — you are likely to get stopped out by normal market noise. Bollinger Bands help visualize volatility expansion and contraction, with the “squeeze” pattern often preceding explosive breakouts.
Economic Calendars and News Feeds
Technical analysis tells you what price is doing. Fundamental analysis tells you why. An economic calendar is non-negotiable — it alerts you to high-impact events like NFP, CPI, and central bank rate decisions that can move pairs 100+ pips in minutes. Pair this with a real-time news feed that aggregates headlines from Reuters, Bloomberg, and ForexFactory, and you have the context needed to avoid trading into a data release blind.
Risk Management Tools
The best analysis in the world means nothing without proper risk controls. A position size calculator ensures every trade risks the same percentage of your account — typically 1-2%. A correlation matrix prevents you from accidentally doubling your exposure by trading two highly correlated pairs in the same direction. And a trade journal — whether a spreadsheet or a dedicated platform like Edgewonk — is the single most underrated tool in forex. You cannot improve what you do not measure.
Putting It All Together
The ideal 2026 trading stack looks something like this: TradingView for charting and idea generation, MT5 for execution through a trusted broker, an economic calendar for event awareness, ATR for position sizing, and a trade journal for continuous improvement. Start with the free versions, master them, and only upgrade when you have a specific need that the free tier cannot meet. The tools are there — the edge comes from how you use them.