Top 5 Trading Indicators Every Forex Trader Needs in 2026
 FXDetails Editorial Team
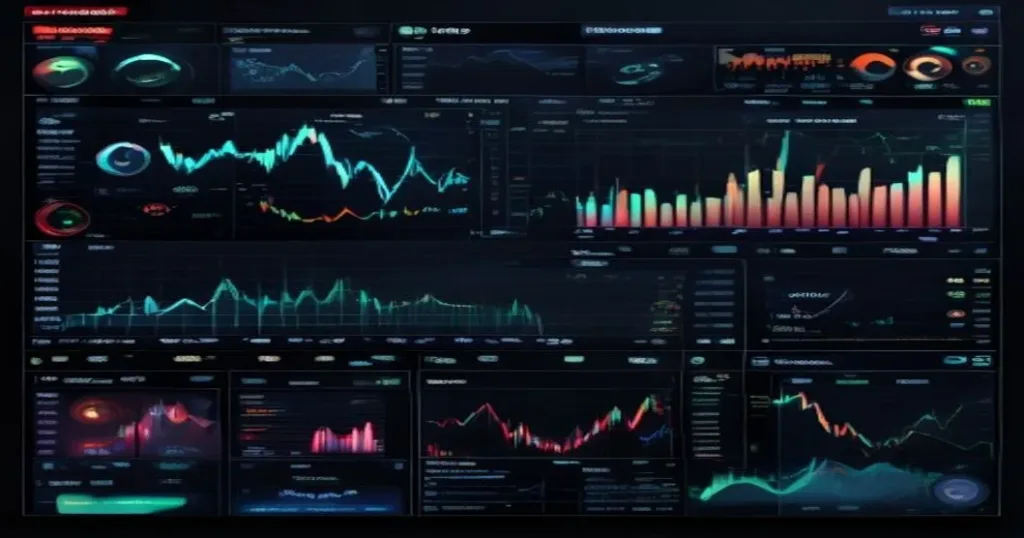
The trading landscape in 2026 has evolved dramatically. Gone are the days when a simple moving average crossover could give you a reliable edge. Today’s markets — driven by algorithmic trading, institutional order flow, and lightning-fast news cycles — demand a more sophisticated toolkit. The right trading indicators can mean the difference between catching a trend early and chasing price after the move is already over.
In this guide, we break down the five most effective trading indicators that serious forex traders are using in 2026. These aren’t just repackaged classics — they represent the cutting edge of technical analysis, combining institutional-grade logic with modern market structure concepts.
1. Structural Flow — Follow the Smart Money
Traditional volume indicators tell you how much traded. Structural Flow tells you who is trading and where they’re positioning. This advanced indicator analyzes the structure of order flow to reveal institutional accumulation and distribution zones before price reflects the activity.
For forex traders, this is invaluable. When a major bank or hedge fund builds a position in EUR/USD, the footprint appears in order flow long before the pair moves. Structural Flow detects these footprints across multiple timeframes, giving retail traders a rare glimpse into the institutional playbook.
2. Supply & Demand Zones — Precision Entry Points
Supply and demand zones are the modern evolution of support and resistance. Unlike horizontal lines drawn by hand, automated S/D zone indicators identify price levels where institutional buyers or sellers have historically stepped in with size. The best implementations — like those available on TradingView — classify zones as fresh (untested) or tested, adjusting their weight based on volume and the speed of price departure.
What makes this approach powerful is the defined risk framework. When price returns to a fresh demand zone, you have a clear entry with a tight stop below the zone — a risk-to-reward setup that institutions themselves use.
3. Adaptive SuperTrend — Volatility-Aware Trend Following
The classic SuperTrend is one of TradingView’s most popular indicators, but it has a fatal flaw: fixed parameters. What works in a trending EUR/JPY fails miserably in a ranging GBP/USD. The Adaptive SuperTrend solves this by dynamically adjusting its sensitivity based on real-time volatility readings.
In low-volatility environments, it tightens to avoid whipsaws. When volatility expands — as it did during the March 2026 tariff-driven USD swings — it loosens to capture the full move without premature exits. This adaptability makes it the go-to trend filter for traders who switch between multiple currency pairs daily.
4. Volume Profile — Market-Generated Levels
Volume Profile isn’t new, but its application has matured significantly. Rather than showing volume over time, it displays volume at price — revealing where the most trading activity has actually occurred. The Point of Control (POC) and Value Area High/Low become natural magnets for price, often acting as stronger support and resistance than any manually drawn line.
In 2026, the best implementations integrate real-time futures volume data alongside spot forex tick volume, giving traders a more complete picture of where liquidity sits. When price approaches a high-volume node, expect a reaction — and plan your trade accordingly.
5. Liquidity Sweep Detection — Catch Reversals Early
Smart money concepts have reshaped how retail traders approach the market, and liquidity sweep detection is the crown jewel. Institutions don’t enter positions at market — they need liquidity. They create it by pushing price above a recent high or below a recent low to trigger stop-losses, then reverse.
A quality liquidity sweep indicator detects these engineered moves in real time. When price sweeps a key level and immediately reverses with a market structure shift, you have a high-probability entry aligned with the institutional direction. Backtesting across major forex pairs shows this pattern delivers a consistent edge, especially on the 1-hour and 4-hour timeframes.
How to Combine These Indicators
The real edge comes from confluence. Here’s a practical framework:
- Step 1: Use Volume Profile to identify the POC and value area — these are your zones of interest.
- Step 2: Overlay Supply & Demand zones to find high-probability reversal areas within those zones.
- Step 3: Check Structural Flow for institutional accumulation or distribution at your level.
- Step 4: Wait for a liquidity sweep at the level, then enter on the market structure shift.
- Step 5: Use Adaptive SuperTrend as your trailing stop to ride the trend.
No single indicator is a holy grail. But when five independent tools all point in the same direction, the probability shifts decisively in your favor. For traders looking to execute these strategies with tight spreads and reliable execution, check out our Exness review or IC Markets review — both brokers offer TradingView integration and institutional-grade execution for retail traders.